
Key Stats for Marketers
Total Number of Marketing Managers Employed in the US
According to the US Bureau of Labor and Statistics (BLS) there are approximately 358,200 (2022) marketing managers (various titles in marketing management) employed in the United States. This article provides the national average and breaks it down for each state.
Projected Job Growth is Faster Than Average
The typical entry-level education required for a marketing role is a Bachelor’s degree. The BLS projects that marketing manager positions in the US will experience 7 percent growth from 2022 to 2032, which is faster than average for occupations, adding 23,700 new marketing manager positions.
National Average Salary for Marketing Managers
US Bureau of Labor and Statistics (BLS): $158,280 mean annual wage for marketing managers.
Salary.com $104,118 and $136,027.
Zip Recruiter: The national average marketing manager salary in the US varies between $60,000 and $98,000 annually with the top 10% earning $125,000.
US News: Marketing Managers made a median salary of $140,040 in 2022. The best-paid 25% made $198,530 that year, while the lowest-paid 25% made $103,060.
* BLS most recent data, May 2022. All other sources are from February 2024.
US States with the Highest Employment Levels for Marketing Managers and Annual Mean Wage for Those States
| State | Employment | Employment per thousand jobs | Hourly mean wage | Annual mean wage | |
|---|---|---|---|---|---|
| Calfornia | 56,920 | 3.23 | $ 89.69 | $ 186,550 | |
| New York | 34,990 | 3.84 | $ 91.46 | $ 190,230 | |
| Texas | 31,030 | 2.39 | $ 66.60 | $ 138,530 | |
| Illinois | 24,080 | 4.09 | $ 68.23 | $ 141,910 | |
| Florida | 14,760 | 1.60 | $ 72.61 | $ 151,020 |
Source: BLS

Percentile Wage Estimates for Marketing Managers (US)
| Percentile | 10% | 25% | 50% (Median) | 75% | |
|---|---|---|---|---|---|
| Hourly Wage | $ 36.92 | $ 49.55 | $ 67.33 | $ 95.45 | |
| Annual Wage | $ 76,790 | $ 103,060 | $ 140,040 | $ 198,530 |
Which Areas of the US Pay Marketers the Most
| Metropolitan area | Employment | Employment per thousand jobs | Location quotient (9) | Hourly mean wage | Annual mean wage (2) |
|---|---|---|---|---|---|
| San Jose-Sunnyvale-Santa Clara, CA | 7,350 | 6.54 | 2.94 | $ 113.98 | $ 237,080 |
| San Francisco-Oakland-Hayward, CA | 13,830 | 5.78 | 2.60 | $ 100.73 | $ 209,510 |
| New York-Newark-Jersey City, NY-NJ-PA | 38,890 | 4.23 | 1.91 | $ 93.41 | $ 194,290 |
| Trenton, NJ | 920 | 3.88 | 1.75 | $ 89.87 | $ 186,920 |
| Fort Collins, CO | 240 | 1.42 | 0.64 | $ 87.40 | $ 181,800 |
| Denver-Aurora-Lakewood, CO | 4,350 | 2.81 | 1.26 | $ 86.32 | $ 179,540 |
| Bridgeport-Stamford-Norwalk, CT | 2,510 | 6.39 | 2.87 | $ 86.05 | $ 178,990 |
| Boulder, CO | 690 | 3.57 | 1.61 | $ 85.56 | $ 177,960 |
| San Diego-Carlsbad, CA | 4,100 | 2.76 | 1.24 | $ 84.68 | $ 176,130 |
| Washington-Arlington-Alexandria, DC-VA-MD-WV | 7,390 | 2.44 | 1.10 | $ 84.53 | $ 175,830 |
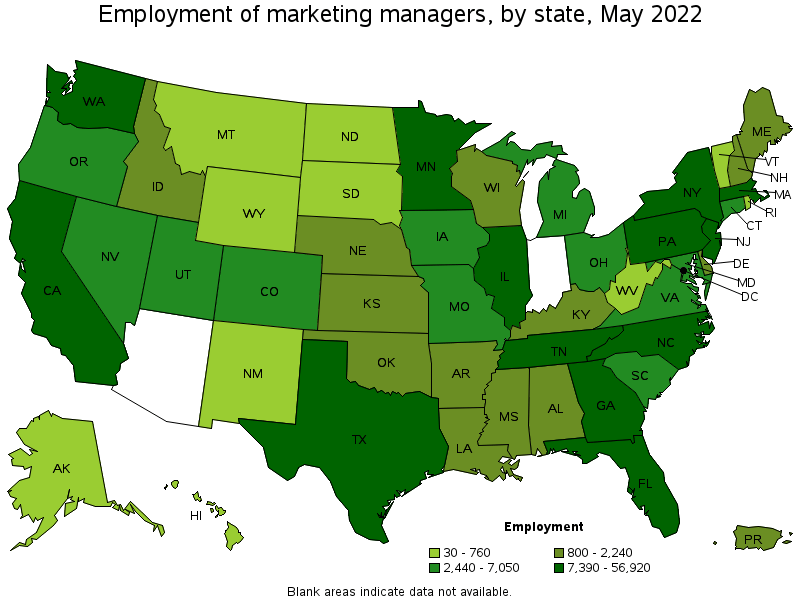
Marketing Manager Jobs – Total Employment, Annual Mean and Medium Wage and Employment Per 1,000 Jobs Broken Down for All 50 US States Plus Territories
| State | Employment(1) | Annual mean wage(2) | Annual median wage(2) | Employment per 1,000 jobs |
|---|---|---|---|---|
| Alabama | 1430 | 134670 | 114910 | 0.712 |
| Alaska | 150 | 108700 | 94660 | 0.501 |
| Arizona | (8) – | 140100 | 129550 | (8) – |
| Arkansas | 1130 | 125150 | 115060 | 0.922 |
| California | 56920 | 186550 | 166390 | 3.228 |
| Colorado | 6110 | 177110 | 164990 | 2.208 |
| Connecticut | 6010 | 160330 | 143310 | 3.686 |
| Delaware | 1380 | 175120 | 167850 | 3.021 |
| District of Columbia | 2750 | 173450 | 161920 | 3.987 |
| Florida | 14760 | 151020 | 132560 | 1.602 |
| Georgia | 9120 | 150010 | 136320 | 1.977 |
| Guam | 160 | (8) – | (8) – | 2.627 |
| Hawaii | 330 | 123130 | 109260 | 0.552 |
| Idaho | 800 | 104280 | 96000 | 0.998 |
| Illinois | 24080 | 141910 | 130010 | 4.092 |
| Indiana | (8) – | 127650 | 120070 | (8) – |
| Iowa | 2440 | 130190 | 127030 | 1.605 |
| Kansas | 1310 | 137960 | 127630 | 0.948 |
| Kentucky | 2080 | 136190 | 117980 | 1.094 |
| Louisiana | 800 | 120450 | 102000 | 0.433 |
| Maine | 1280 | 128120 | 118000 | 2.102 |
| Maryland | 4800 | 145050 | 131140 | 1.820 |
| Massachusetts | 13540 | 165380 | 162110 | 3.797 |
| Michigan | 5540 | 129730 | 125150 | 1.304 |
| Minnesota | 7750 | 160110 | 156330 | 2.740 |
| Mississippi | 880 | 96310 | 82270 | 0.776 |
| Missouri | 2850 | 129740 | 113380 | 1.012 |
| Montana | 180 | 134630 | 117500 | 0.373 |
| Nebraska | 1990 | 114460 | 102590 | 2.047 |
| Nevada | 3720 | 111560 | 81970 | 2.636 |
| New Hampshire | 1200 | 160880 | 139930 | 1.820 |
| New Jersey | 11830 | 184820 | 170980 | 2.879 |
| New Mexico | 470 | 126040 | 107610 | 0.572 |
| New York | 34990 | 190230 | 172490 | 3.841 |
| North Carolina | 10420 | 144790 | 133980 | 2.241 |
| North Dakota | 170 | 126730 | 118960 | 0.422 |
| Ohio | 7050 | 141400 | 130680 | 1.311 |
| Oklahoma | 1330 | 134200 | 117190 | 0.828 |
| Oregon | 4810 | 132280 | 126110 | 2.538 |
| Pennsylvania | 10030 | 131590 | 123470 | 1.726 |
| Puerto Rico | 810 | 99640 | 84900 | 0.903 |
| Rhode Island | 760 | 173810 | 163800 | 1.595 |
| South Carolina | 3150 | 120120 | 107000 | 1.462 |
| South Dakota | 100 | 143780 | 128670 | 0.225 |
| Tennessee | 7390 | 142660 | 124470 | 2.368 |
| Texas | 31030 | 138530 | 125340 | 2.388 |
| Utah | 5110 | 129900 | 126020 | 3.142 |
| Vermont | 530 | 129070 | 125630 | 1.809 |
| Virgin Islands | 30 | 80950 | 67330 | 0.954 |
| Virginia | 5580 | 170960 | 163350 | 1.441 |
| Washington | 8400 | 164630 | 147320 | 2.466 |
| West Virginia | 280 | 104390 | 88870 | 0.409 |
| Wisconsin | 2240 | 141490 | 128350 | 0.796 |
| Wyoming | 140 | (8) – | (8) – | 0.524 |
| Footnotes: (1) Estimates for detailed occupations do not sum to the totals because the totals include occupations not shown separately. Estimates do not include self-employed workers. (2) Annual wages have been calculated by multiplying the corresponding hourly wage by 2,080 hours. (8) Estimate not released. | ||||
| SOC code: Standard Occupational Classification code — see http://www.bls.gov/soc/home.htm Data extracted from the BLS database on February 06, 2024 | ||||
This article will be periodically updated to keep it current.


